Most Popular Participation Sports
According to a study of over 2,500 people conducted by NPR and the Harvard School of Public Health, the top participation sports for adults were the following:
• Golf
• Basketball
• Baseball or softball
• Soccer
• Running or track
• Football
• Tennis
• Swimming
• Biking
• Volleyball
Participation, however, varies by gender and generation.
| Men ages 18‐29 Women ages 18‐29 | |||||
| 48% 23% | |||||
| 1t | Basketball | 22 | 1 | Baseball/softball | 16 |
| 1t | Soccer | 22 | 2 | Volleyball | 13 |
| 3 | Football | 13 | 3 | Running/track | 12 |
| 4 | Baseball/softball | 6 | 4 | Tennis | 11 |
| 5 | Running/track | 5 | 5 | Basketball | 9 |
| Men ages 30‐49 Women ages 30‐49 | |||||
| 38% 15% | |||||
| 1 | Basketball | 14 | 1 | Running/track | 19 |
| 2t | Soccer | 10 | 2 | Volleyball | 11 |
| 2t | Golf | 10 | 3 | Baseball/softball | 9 |
| 2t | Baseball/softball | 10 | 4 | Soccer | 8 |
| 5 | Running/track | 9 | 5 | Biking | 6 |
| Men ages 50‐64 Women ages 50‐64 | |||||
| 24% 16% | |||||
| 1 | Golf | 25 | 1t | Golf | 9 |
| 2 | Baseball/softball | 9 | 1t | Walking | 9 |
| 3 | Basketball | 8 | 3t | Biking | 8 |
| 4 | Running/track | 7 | 3t | Swimming | 8 |
| 5 | Biking | 6 | 5t | Tennis | 7 |
| 5t | Dance | 7 | |||
| Men ages 65+ Women ages 65+ | |||||
| 32% 9% | |||||
| 1 | Golf | 44 | 1 | Walking | 18 |
| 2 | Basketball | 6 | 2 | Swimming | 14 |
| 3 | Baseball/softball | 6 | 3 | Golf | 13 |
| 4t | Tennis | 4 | 4 | Tennis | 11 |
| 4t | Walking | 4 | 5 | Bowling | 10 |
| 4t | Fishing | 4 | |||
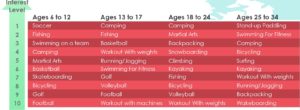
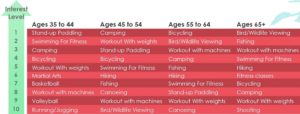
Participation and interest in sports are also two different things. A person may have an interest in an activity but can not do it because they do not have the time, money, or health. According to the Physical Activity Council in a study of over 20,000 people: